
Campus 101
6864 Registered
Allowed team size:
1
6864 Registered
Allowed team size:
1
This campaign is over.
hackathon
Online
starts on:
Dec 06, 2020, 06:24 PM UTC (UTC)
ends on:
Dec 06, 2020, 06:25 PM UTC (UTC)
Machine Learning
Where do I stand?
Take this short self-assessment quiz!
Statistics for Data Science
Finding structure in data and making predictions are the most important steps in Data Science. Here, in particular, statistical methods are essential since they are able to handle many different analytical tasks. Statistics and algebra initially helps you identify trends in data and do basic hypothesis testing. As you continue your journey, you realise that it comprises the ‘science’ in Data Science. It is the core of all machine learning algorithms. It helps you compare and assess different models and score them. Here we give you a basic overview of the fundamental statistical concepts
Probability:
Probability gives the information about how likely an event can occur. Digging into the terminology of the probability:
- Trial or Experiment: The act that leads to a result with certain possibility.
- Sample space: The set of all possible outcomes of an experiment.
- Event: Non empty subset of sample space is known as event.
Conditional Probability [P(A|B)] is the likelihood of an event occurring, based on the occurrence of a previous event.
Independent events are events whose outcome does not influence the probability of the outcome of another event; P(A|B) = P(A).
Mutually Exclusive events are events that cannot occur simultaneously; P(A|B) = 0.
Probability Distribution Functions
- Probability Density Function (PDF): a function for continuous data where the value at any point can be interpreted as providing a relative likelihood that the value of the random variable would equal that sample. (Wiki)
- Probability Mass Function (PMF): a function for discrete data which gives the probability of a given value occurring.
- Cumulative Density Function (CDF): a function that tells us the probability that a random variable is less than a certain value; the integral of the PDF.
Continuous Data Distributions
- Uniform Distribution: a probability distribution where all outcomes are equally likely.
- Normal/Gaussian Distribution: commonly referred to as the bell curve and is related to the central limit theorem; has a mean of 0 and a standard deviation of 1.
- T-Distribution: a probability distribution used to estimate population parameters when the sample size is small and/r when the population variance is unknown (see more here).
- Chi-Square Distribution: distribution of the chi-square statistic (see here).
Discrete Data Distributions
- Poisson Distribution: probability distribution that expresses the probability of a given number of events occurring within a fixed time period.
- Binomial Distribution: a probability distribution of the number of successes in a sequence of n independent experiences each with its own Boolean-valued outcome (p, 1-p).
Data Types:
- Numerical: data expressed with digits; is measurable. It can either be discrete or continuous.
- Categorical: qualitative data classified into categories. It can be nominal (no order) or ordinal (ordered data).
Measures of Variability
- Range: the difference between the highest and lowest value in a dataset.
- Variance (σ2): measures how spread out a set of data is relative to the mean.
- Standard Deviation (σ): another measurement of how spread out numbers are in a data set; it is the square root of variance.
- Z-score: determines the number of standard deviations a data point is from the mean.
- R-Squared: a statistical measure of fit that indicates how much variation of a dependent variable is explained by the independent variable(s); only useful for simple linear regression.
Bayes Theorem:
a mathematical formula for determining conditional probability. “The probability of A given B is equal to the probability of B given A times the probability of A over the probability of B.
Algebra:
Refresh your knowledge on algebra here
To show the relevance of linear algebra in the field of data science, we are briefly going through two relevant applications.
Singular Value Decomposition (SVD)
The singular value decomposition (SVD) is a very important concept within the field of data science. Some important applications of the SVD are image compression and dimensionality reduction. Let us focus on the latter application here. Dimensionality reduction is the transformation of data from a high-dimensional space into a lower-dimensional space, in such a way that the most important information of the original data is still retained. This is desirable, since the analyzing of the data becomes computationally intractable once the dimension of the data is too high.
The singular values can be used to understand the amount of variance that is explained by each of the singular vectors. The more variance it captures, the more information it accounts for. In this way, we can use this information to limit the number of vectors to the amount of variance we wish to capture.
Principal Component Analysis (PCA)
Just as the singular value decomposition, principal component analysis (PCA) is an alternative technique to reduce dimensionality. The objective of PCA is to create new uncorrelated variables, called the principal components, that maximize the captured variance. So, the idea is to reduce the dimensionality of the data set, while preserving as much ‘variability’ (that is, information) as possible. This problem reduces to solving an eigenvalue-eigenvector problem.
Probability based approx question
Let’s begin: Machine Learning
Data Handling:
Hold on there! You may think you don’t need this section, but we ask you to think twice.
Did you know that a data scientist spends 60-80% of their productive development time in cleaning and manipulating data?!
In this section, you'll meet your dear friend pandas and numpy who will help you with basic data manipulation. Instead of going into theory, we'll take a practical approach. We’ll focus on the hacks that are crucial to different kinds of problems - regression, NLP and/or Deep Learning basics.
First, we'll understand the syntax and commonly used functions of the respective libraries. Later, we'll work on a real-life data set.
Click here to zoom through the data handling lens and learn data cleaning & manipulation thoroughly.
Note: This tutorial is best suited for people who know the basics of python. No further knowledge is expected. Make sure you have python installed on your laptop.
Hacks for you:
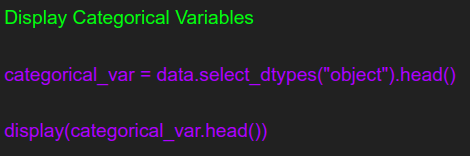
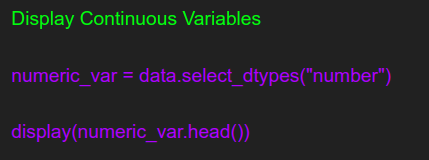
Categorical vs. Continuous variable:
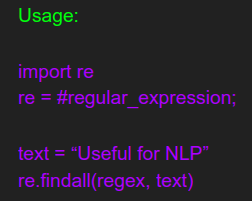
RegEx: cheat sheet
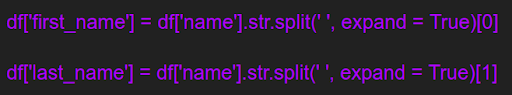
String column slicer:
Deal with your Emotions:

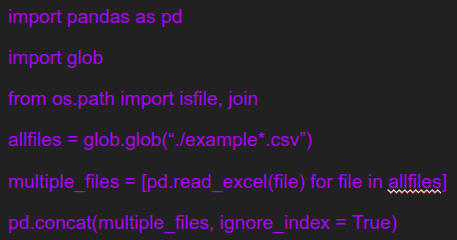
Read multiple files:
Deal with overfitting and underfitting by bagging and boosting
Level Up:
Challenge
Regression Analysis
Regression analysis, a favorite amongst statisticians, is used to describe the relationships between a set of independent variables and the dependent variable. Regression analysis produces a regression equation where the coefficients represent the relationship between each independent variable and the dependent variable. You can also use the equation to make predictions.
Regression analysis is a load-bearer for a lot of things in the Data science world. For example, it can be used to
- Model multiple independent variables
- Include continuous and categorical variables
- Use polynomial terms to model curvature
- Assess interaction terms to determine whether the effect of one independent variable depends on the value of another variable
These capabilities are all cool, but there is another almost magical ability. Regression analysis can unscramble very intricate problems where the variables are entangled like spaghetti. For example, imagine you’re a researcher studying any of the following:
- Do socio-economic status and race affect educational achievement?
- Do education and IQ affect earnings?
- Do exercise habits and diet effect weight?
- Are drinking coffee and smoking cigarettes related to mortality risk?
- Does a particular exercise intervention have an impact on bone density that is a distinct effect from other physical activities?
Regression analysis is a form of inferential statistics. It can help you show you how to control the independent variables by estimating the effect that changing one independent variable has on the dependent variable while holding all the other independent variables constant. This process allows you to learn the role of each independent variable without worrying about the other variables in the model. Your goal is to minimize the effect of confounding variables.
Decode how to deal with regression here
Level Up:
Bucketing & Segmentation
Classification is a process of categorizing a given set of data into classes, It can be performed on both structured or unstructured data. The process starts with predicting the class of given data points. The classes are often referred to as target, label or categories.
Depending on the data, classification can be as basic as inputting the data into a decision tree or will need a lot of pampering (cleaning, bagging, boosting, sampling, etc.) before you feed it into a classifier. Following are the most widely used classifiers that are used for majority of the Data science problems:
- Logistic Regression
- Naive Bayes’ classifier
- Random-Forest & Parameter Tuning
- XG-Boost classifiers
- Clustering
Working with a classification problem:
Classifier Evaluation
The most important part after the completion of any classifier is the evaluation to check its accuracy and efficiency. There are a lot of ways in which we can evaluate a classifier. Let us take a look at these methods listed below.
Holdout Method
This is the most common method to evaluate a classifier. In this method, the given data set is divided into two parts as a test and train set 20% and 80% respectively.
The train set is used to train the data and the unseen test set is used to test its predictive power.
Cross-Validation
Overfitting is the most common problem prevalent in most of the machine learning models. K-fold cross-validation can be conducted to verify if the model is over-fitted at all.
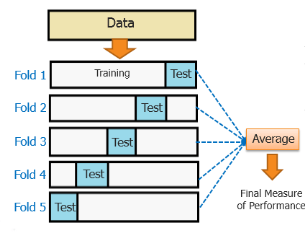
In this method, the data set is randomly partitioned into k mutually exclusive subsets, each of which is of the same size. Out of these, one is kept for testing and others are used to train the model. The same process takes place for all k folds.
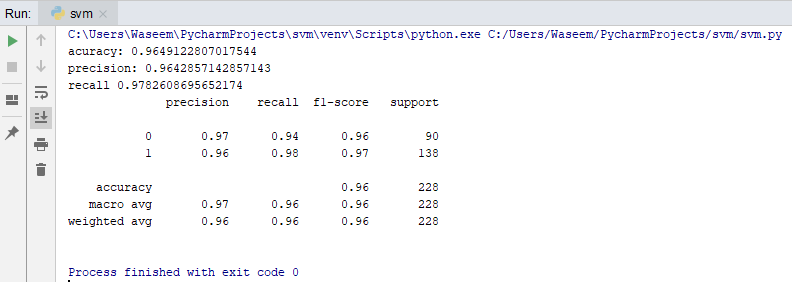
Classification Report
A classification report will give the following results, it is a sample classification report of an SVM classifier using a cancer_data dataset.
- Accuracy
- Accuracy is a ratio of correctly predicted observation to the total observations
- True Positive: The number of correct predictions that the occurrence is positive.
- True Negative: Number of correct predictions that the occurrence is negative.
- F1- Score
- It is the weighted average of precision and recall
- Precision And Recall
- Precision is the fraction of relevant instances among the retrieved instances, while recall is the fraction of relevant instances that have been retrieved over the total number of instances. They are basically used as the measure of relevance.
ROC Curve
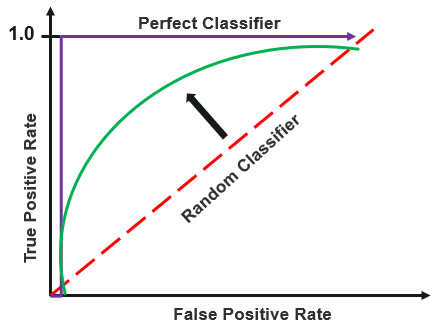
Receiver operating characteristics or ROC curve is used for visual comparison of classification models, which shows the relationship between the true positive rate and the false positive rate. The area under the ROC curve is the measure of the accuracy of the model.
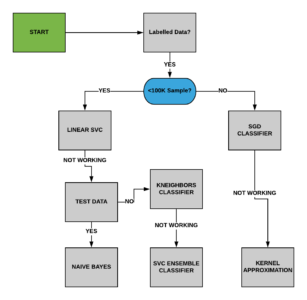
Algorithm Selection
Level Up:
Deep Learning
Deep learning is a machine learning technique that teaches computers to do what comes naturally to humans: learn by example. Deep learning is a key technology behind driverless cars, enabling them to recognize a stop sign, or to distinguish a pedestrian from a lamppost. It is the key to voice control in consumer devices like phones, tablets, TVs, and hands-free speakers. Deep learning is getting lots of attention lately and for good reason. It’s achieving results that were not possible before.
In deep learning, a computer model learns to perform classification tasks directly from images, text, or sound. Deep learning models can achieve state-of-the-art accuracy, sometimes exceeding human-level performance. Models are trained by using a large set of labeled data and neural network architectures that contain many layers.
Understand the concepts of Deep Learning in detail here.
Deep Learning has spread its neurons in almost every use-case today- time series forecasting to text analysis to Image recognition. But is that really required? We have seen a lot of cases where Naive Bayes’ classifier has performed and yielded better results than keras applications. In the real world, how do you choose between Deep Learning and Machine Learning? Here’s a short guide to enable your decision making process:
Machine learning offers a variety of techniques and models you can choose based on your application, the size of data you're processing, and the type of problem you want to solve. A successful deep learning application requires a very large amount of data (thousands of images) to train the model, as well as GPUs, or graphics processing units, to rapidly process your data.
When choosing between machine learning and deep learning, consider whether you have a high-performance GPU and lots of labeled data. If you don’t have either of those things, it may make more sense to use machine learning instead of deep learning. Deep learning is generally more complex, so you’ll need at least a few thousand records of data/images to get reliable results. Having a high-performance GPU means the model will take less time to analyze all those data.
Most common use cases of Deep Learning are centered around:
- Image Processing
- NLP:
- Auto-generate content
- Reinforcement Learning
- Unsupervised Learning
Level Up:
P.S.: I am skipping the most fascinating GPT model use case out on purpose here. But feel free to research around it.
Industry Applications
ML in FinTech:
Financial institutions have a wide range of applications for Machine Learning. The use-cases however work with a marriage of data analytics and data science. What’s more interesting is that fintech use cases help you learn and analyse if a given problem statement can be solved using general heuristics or needs machine learning approach. Click here to learn the most common use case of ML in FinTech
ML in Networking:
ML, a subset of AI, is a prerequisite for any successful deployment of AI technologies. ML uses algorithms to parse data, learn from it, and determines or predicts without requiring explicit instructions. With that said, AI/ML can be leveraged for tasks in the networking domain like self-correction for maximum uptime, predicting user experience to dynamically adjust bandwidth demand, detect malware attack and leveraging data mining techniques to identify/troubleshoot root-causes.
ML for all:
We started with “predict the stock close price” and today we are working with analysis of all news articles to extract and predict the impact each event across the globe can have on the stock you own. We have evolved from “Ok, Google” to voice-controlled home assistants. From analysis of purchase trends to analysis of consumer sentiment and behavior during purchase activities, ML applications are constantly under evolution and development. Where there is data, there is a scope for data science. Few basic applications of machine learning in today’s world include:
- Recommendation engine
- OCR
- Chatbots
Level Up:
End to end deployment of ML model for streaming data
Am I ready to be a Data Scientist?
Interview tips:
- Is it a Machine Learning problem? Check to see if the problem can be solved using simple heuristics and statistics before starting an application of ML models.
- Ask what matters to them before jumping into prediction. Take a closer look at the business insights that matter to the interviewer.
- Do you really need to go deep? While it may seem that deep learning will give you the best results, it may not be applicable to the company.
- How much empirical data do they have?
- What is the infrastructure they are working with?
- What is the time they are willing to wait for the results?
- Think big when there’s data: How your model performs is highly dependent on what data it receives. Understand the data architecture you are working on and how it is planned to scale. Understand the extent to which your involvement will be required to clean the data.
- Ensure you yourself are in a reinforcement learning environment. :)
Want to know more about the recruitment of data scientists? Click here to learn.